Djangoでcontextでテンプレートに渡す変数をHTMLエスケープさせない方法
Djangoでcontextでテンプレートに渡す変数をHTMLエスケープさせない方法をご紹介します。
条件
- Django 2.1.2
- Python 3.7.0
views.pyの設定
detail.htmlを表示する際、contextで「x_data」および「y_data」を渡すようにします。
from django.http import HttpResponse
from django.views import generic
from .models import Location, Greenhouse
from django.contrib.auth.decorators import login_required
from django.contrib.auth.mixins import LoginRequiredMixin
import io

class IndexView(LoginRequiredMixin, generic.ListView):
    model = Location
    paginate_by = 5
    ordering = ['-updated_at']
    template_name = 'monitor/index.html'


class DetailView(generic.DetailView):
    model = Location
    template_name = 'monitor/detail.html'


    def get_context_data(self, **kwargs):
        context = super().get_context_data(**kwargs)  # はじめに継承元のメソッドを呼び出す

        x = ["Red", "Blue", "Yellow", "Green", "Purple", "Orange"]
        y = [12, 19, 30, 50, 20, 30]

        context['x_data'] = x
        context['y_data'] = y

        return context
テンプレート(detail.html)の設定
{{ x_data }}および{{ y_data }}でviewから渡されたデータリストをセットしています。
NGケース
labelに{{ x_data }}、dataに{{ y_data }}を渡しています。
{% extends 'base.html' %}
{% block content %}
<h1>{{ object.name }}</h1>
<section class="post-text">
{{ object.memo|linebreaksbr }}
</section>
<section class="post-date">
<p>Created: {{ object.created_at }}<span>/</span>Updated: {{ object.updated_at }}</p>
</section>
<script src="https://cdnjs.cloudflare.com/ajax/libs/Chart.js/2.7.3/Chart.bundle.min.js"></script>
<canvas id="myChart" style="width: 100%; height:300px;"></canvas>
<script type="text/javascript">
var chartChart = document.getElementById("myChart");
new Chart(chartChart, {
type: 'bar',
data: {
labels: {% autoescape off %} {{ x_data }} {% endautoescape %},
datasets: [{
label: '# of Votes',
data: {{ y_data }},
backgroundColor: [
'rgba(255, 99, 132, 0.2)',
'rgba(54, 162, 235, 0.2)',
'rgba(255, 206, 86, 0.2)',
'rgba(75, 192, 192, 0.2)',
'rgba(153, 102, 255, 0.2)',
'rgba(255, 159, 64, 0.2)'
],
borderColor: [
'rgba(255,99,132,1)',
'rgba(54, 162, 235, 1)',
'rgba(255, 206, 86, 1)',
'rgba(75, 192, 192, 1)',
'rgba(153, 102, 255, 1)',
'rgba(255, 159, 64, 1)'
],
borderWidth: 1
}]
},
options: {
scales: {
yAxes: [{
ticks: {
beginAtZero:true
}
}]
}
}
});
</script>
<section>
<p><a href="javascript:history.back()">< Back</a></p>
</section>
{% endblock %}
detail.htmlを開いてもグラフが描画されません。

HTMLソースを確認すると、labelsにhtmlエスケープしたデータがセットされていることがわかります。
これが悪さをしているようです。
# HTMLソース抜粋
<script src="https://cdnjs.cloudflare.com/ajax/libs/Chart.js/2.7.3/Chart.bundle.min.js"></script>
<canvas id="myChart" style="width: 100%; height:300px;"></canvas>
<script type="text/javascript">
    var chartChart = document.getElementById("myChart");
    new Chart(chartChart, {
        type: 'bar',
        data: {
            labels:  ['Red', 'Blue', 'Yellow', 'Green', 'Purple', 'Orange'] ,
            datasets: [{
                label: '# of Votes',
                data: [12, 19, 30, 50, 20, 30],
                backgroundColor: [
                    'rgba(255, 99, 132, 0.2)',
                    'rgba(54, 162, 235, 0.2)',
                    'rgba(255, 206, 86, 0.2)',
                    'rgba(75, 192, 192, 0.2)',
                    'rgba(153, 102, 255, 0.2)',
                    'rgba(255, 159, 64, 0.2)'
                ],
                borderColor: [
                    'rgba(255,99,132,1)',
                    'rgba(54, 162, 235, 1)',
                    'rgba(255, 206, 86, 1)',
                    'rgba(75, 192, 192, 1)',
                    'rgba(153, 102, 255, 1)',
                    'rgba(255, 159, 64, 1)'
                ],
                borderWidth: 1
            }]
        },
        options: {
            scales: {
                yAxes: [{
                    ticks: {
                        beginAtZero:true
                    }
                }]
            }
        }
    });
</script>
OKケース
文字列データ{{ x_data }}を{% autoescape off %}{% endautoescape %}で囲うことでhtmlエスケープしないようにしています。
{% extends 'base.html' %}
{% block content %}
<h1>{{ object.name }}</h1>
<section class="post-text">
{{ object.memo|linebreaksbr }}
</section>
<section class="post-date">
<p>Created: {{ object.created_at }}<span>/</span>Updated: {{ object.updated_at }}</p>
</section>
<script src="https://cdnjs.cloudflare.com/ajax/libs/Chart.js/2.7.3/Chart.bundle.min.js"></script>
<canvas id="myChart" style="width: 100%; height:300px;"></canvas>
<script type="text/javascript">
var chartChart = document.getElementById("myChart");
new Chart(chartChart, {
type: 'bar',
data: {
labels: {% autoescape off %} {{ x_data }} {% endautoescape %},
datasets: [{
label: '# of Votes',
data: {{ y_data }},
backgroundColor: [
'rgba(255, 99, 132, 0.2)',
'rgba(54, 162, 235, 0.2)',
'rgba(255, 206, 86, 0.2)',
'rgba(75, 192, 192, 0.2)',
'rgba(153, 102, 255, 0.2)',
'rgba(255, 159, 64, 0.2)'
],
borderColor: [
'rgba(255,99,132,1)',
'rgba(54, 162, 235, 1)',
'rgba(255, 206, 86, 1)',
'rgba(75, 192, 192, 1)',
'rgba(153, 102, 255, 1)',
'rgba(255, 159, 64, 1)'
],
borderWidth: 1
}]
},
options: {
scales: {
yAxes: [{
ticks: {
beginAtZero:true
}
}]
}
}
});
</script>
<section>
<p><a href="javascript:history.back()">< Back</a></p>
</section>
{% endblock %}
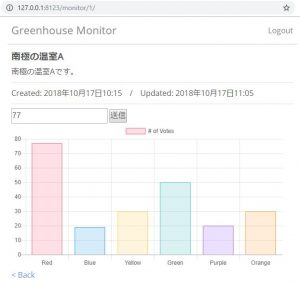
detail.htmlを開くと正しくグラフが表示されます。

HTMLソースを確認すると、データが正しくセットされていることがわかります。
# HTMLソース抜粋
<script src="https://cdnjs.cloudflare.com/ajax/libs/Chart.js/2.7.3/Chart.bundle.min.js"></script>
<canvas id="myChart" style="width: 100%; height:300px;"></canvas>
<script type="text/javascript">
var chartChart = document.getElementById("myChart");
new Chart(chartChart, {
type: 'bar',
data: {
labels: ['Red', 'Blue', 'Yellow', 'Green', 'Purple', 'Orange'] ,
datasets: [{
label: '# of Votes',
data: [12, 19, 30, 50, 20, 30],
backgroundColor: [
'rgba(255, 99, 132, 0.2)',
'rgba(54, 162, 235, 0.2)',
'rgba(255, 206, 86, 0.2)',
'rgba(75, 192, 192, 0.2)',
'rgba(153, 102, 255, 0.2)',
'rgba(255, 159, 64, 0.2)'
],
borderColor: [
'rgba(255,99,132,1)',
'rgba(54, 162, 235, 1)',
'rgba(255, 206, 86, 1)',
'rgba(75, 192, 192, 1)',
'rgba(153, 102, 255, 1)',
'rgba(255, 159, 64, 1)'
],
borderWidth: 1
}]
},
options: {
scales: {
yAxes: [{
ticks: {
beginAtZero:true
}
}]
}
}
});
</script>
参考
組み込みタグとフィルタの詳細は以下のサイトを参照してください。
https://docs.djangoproject.com/ja/2.1/ref/templates/builtins/
Django