C#でChartの値をツールチップで表示する方法
C#でChartの値をツールチップで表示する方法をご紹介します。
目次
条件
- Visual Studio 2017
前提
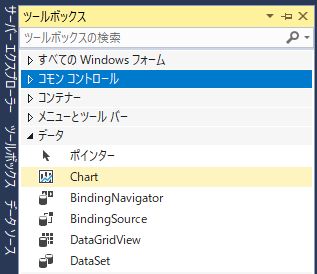
以下のように、ツールボックスから「Chart」を選択し、フォームにChartを配置しているものとします。

実装
サンプルソース
以下のように、グラフの表示およびMouseMoveのメソッドを記述します。
using System;
using System.Collections.Generic;
using System.ComponentModel;
using System.Data;
using System.Drawing;
using System.Linq;
using System.Text;
using System.Threading.Tasks;
using System.Windows.Forms;
using System.Windows.Forms.DataVisualization.Charting;

namespace sample2
{
    public partial class Form1 : Form
    {
        Point? prevPosition = null; // グラフ上の位置(グラフデータ表示用)
        ToolTip tooltip = new ToolTip(); // ツールチップ(グラフデータ表示用)

        public Form1()
        {
            InitializeComponent();

            PlotSinCos(); // グラフの設定
        }

        // グラフの設定
        private void PlotSinCos()
        {
            // 1.Seriesの追加
            chart1.Series.Clear();
            chart1.Series.Add("sin");
            chart1.Series.Add("cos");

            // 2.グラフのタイプの設定
            chart1.Series["sin"].ChartType = System.Windows.Forms.DataVisualization.Charting.SeriesChartType.Line;
            chart1.Series["cos"].ChartType = System.Windows.Forms.DataVisualization.Charting.SeriesChartType.Line;

            // 3.座標の入力
            for (double theta = 0.0; theta <= 2 * Math.PI; theta += Math.PI / 360)
            {
                chart1.Series["sin"].Points.AddXY(theta, Math.Sin(theta));
                chart1.Series["cos"].Points.AddXY(theta, Math.Cos(theta));
            }
        }

        private void chart1_MouseMove(object sender, MouseEventArgs e)
        {
            var pos = e.Location;
            if (prevPosition.HasValue && pos == prevPosition.Value)
                return;

            tooltip.RemoveAll();
            prevPosition = pos;
            var results = chart1.HitTest(pos.X, pos.Y, false, ChartElementType.DataPoint);

            foreach (var result in results)
            {
                if (result.ChartElementType == ChartElementType.DataPoint) // データポイントの場合
                {
                    var valueY = result.ChartArea.AxisY.PixelPositionToValue(pos.Y);
                    tooltip.Show(((float)valueY).ToString(), chart1, pos.X, pos.Y - 15); // ツールチップを表示
                }
            }
        }
    }
}
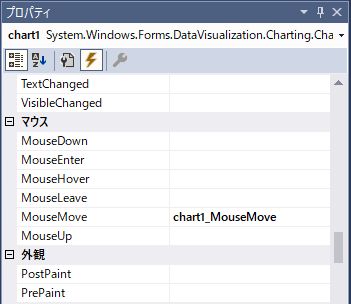
プロパティ設定
デザイン画面において、Chartのプロパティで、マウス:MouseMoveにサンプルソースで記述したメソッド「chart1_MouseMove」を指定します。
実行結果
グラフのデータ上をマウスカーソルが横切ると、対象データのY軸の値がツールチップで表示されます。

参考
stackoverflow:Display tooltip when mouse over the line chart
https://stackoverflow.com/questions/33978447/display-tooltip-when-mouse-over-the-line-chart


C#を触っている者です。
マウスの位置を軸の値に変換する方法を探していましたが、この記事を見てできるようになりました。
とても助かりました。
ありがとうございました。